The wide coverage of the drought in Panama and the crowding of ships at the canal makes for sad reading. The people in charge at the Panama Canal Authority (ACP) have called this year’s water problem a “unprecedented challenge.”
The canal will get more attention from the media the more they talk about it. Shipping journalists’ inboxes have started to get flooded with emails from PR firms with their clients’ expert opinions on things like “the historic drought is going to mess up global supply chains,” “Panama Canal gridlock is affecting the global supply chain,” and “looming potential shortages as the Panama Canal restrictions affect holiday stocks.”
The truth is that the limits on the Panama Canal have not hurt American shoppers.
Executives and experts in the marine business have not said that there is a problem. Even if the drought in Panama lasts for a long time, the supply line will be able to find other solutions.
Impact of ACP’s Maximum Ship Draft Reduction on Shipping Traffic and Waiting Times
Now that the ACP’s maximum ship draft is just 44 feet, fewer ships may pass through each day. The goal is to reduce the daily average of transits through the Panama Canal locks from 36 to 32, with the number of passages through the older Panamax locks reduced from 26 to 22, and the number of passages through the bigger, more modern Neopanamax locks maintained at 10.
The longer dry season hasn’t yet shown up in ACP data on the average number of transits per month, which is affected by demand and the size of the canals.
Compared to July 2022 and July 2021, 9.9 Neopanamax ships went through the canal on average last month. The number of ships that went through the port in July (33.4) was about the same as it was in the same month the two years before (within one ship per day).
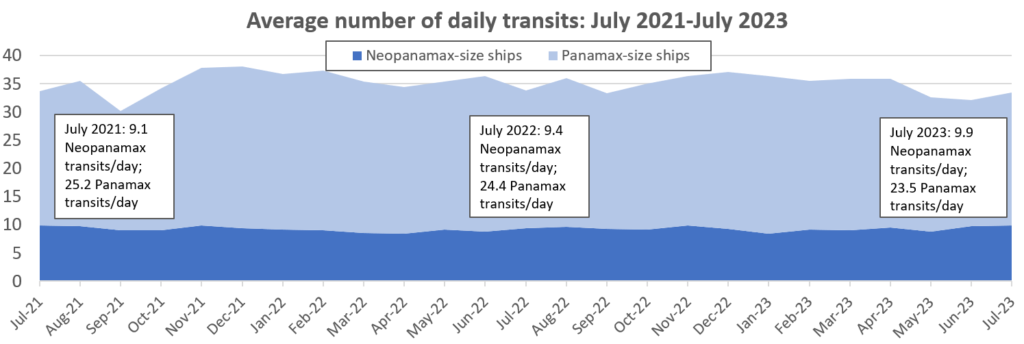
(Chart: based on data from ACP)
Statistics from the ACP show that the usual waiting time goes up a lot in July and August, but this doesn’t apply to container ships.
As of Tuesday, the average wait for a ship to cross from the Pacific to the Atlantic in August rose to 11.5 days, which is more than five times what it was in June.
In August, it took an average of 9.7 days for a ship to cross the Atlantic and reach the Pacific.
All of the growth was caused by longer waits for non-containerized boats like general cargo ships, tankers, dry bulk carriers, and liquid petroleum gas (LPG) carriers. Most cargo ships have been late by less than a day.
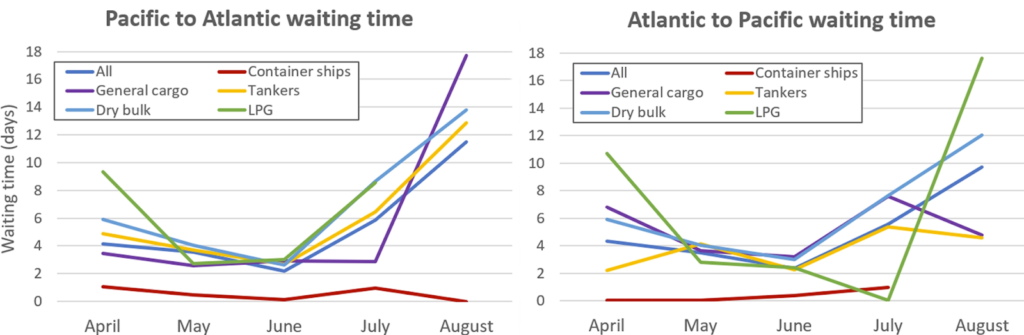
(Charts: based on data from ACP)
Canal authority says queue only 30% above normal
The media has paid close attention to the lines of commercial ships waiting to cross at both ends of the canal. This reminds them of how they covered the container ship pileup off the coast of Southern California in 2021 and 2022.
As of Wednesday, MarineTraffic’s ship-position data still showed lines of ships that were very pleasing to look at.
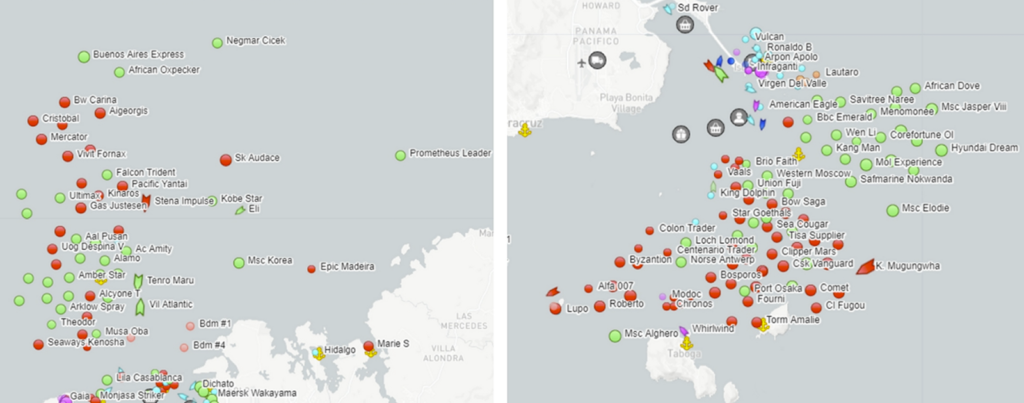
Ship positions for all vessel types as of Wednesday. Left: Atlantic entrance. Right: Pacific entrance. (Maps: MarineTraffic)
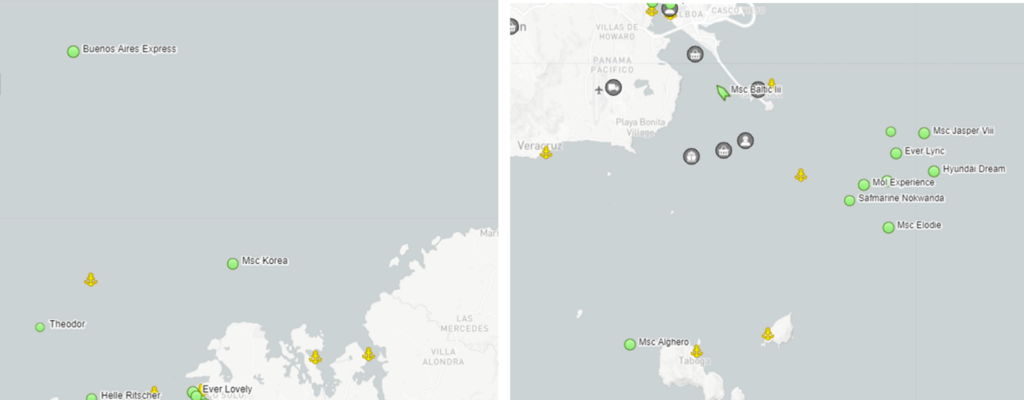
Some of these ships may be waiting to call at Panamanian transshipment hubs instead of waiting for canal transits. However, when the ship-position data is adjusted to show only cargo ships, the line is quite small.
On Friday, the Wall Street Journal said that more than 200 boats were waiting on each side of the passage based on details about where the ships were.
ACP’s Response to Increased Shipping Traffic and Waiting Times
The ACP says that the numbers are much smaller.
As of Wednesday, there were 119 boats ready to go through the canal, and 45 of them had made bookings. The rest of the 74 ships did not. Statistics from the ACP show that under normal conditions, there would be about 90 ships waiting. The current line is only 30% longer than usual.
Over the years, water shortages and other problems have caused canals to take longer to finish. Kpler, a source of data on commodities, keeps track of how long dry bulk ships, tanks (both oil and product) and LPG carriers are waiting in line to go through the canal.
Kpler Data Shows Decrease in Wait Times for Ships at Panama Canal
The most recent data from Kpler shows that the wait times for ships are normal and much lower than they were in spring 2022, when they were at their highest. The wait times for LPG carriers are also lower now than they were at the end of 2022, when they were at their highest.
This is one of the few times that a large queue is empty. This month, there has been a lot of catching up to do with dry bulk orders. Kpler data shows that it hit 91 ships at the beginning of August. But the time you have to wait has been cut in half. As of Sunday, the number of bulkers in the fleet had dropped to 55, which is about the same as the all-time high.
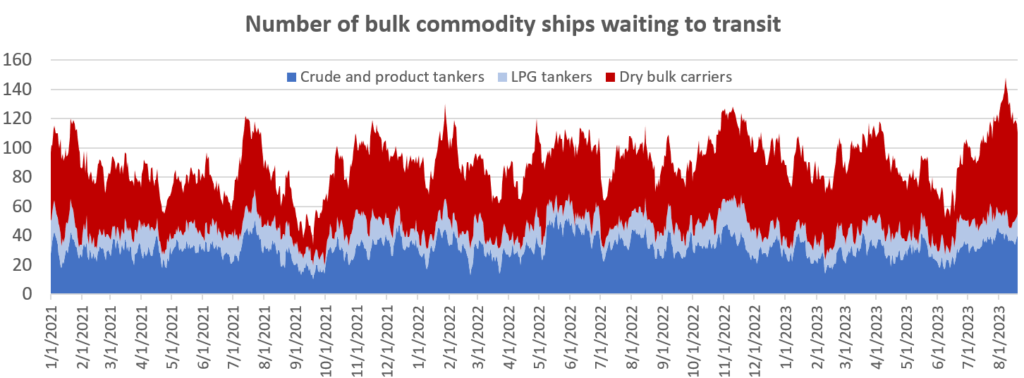
(Chart: based on data from Kpler)
Contact Lading Logistics For Comprehensive Logistics Solutions
Overall, the canal, which relies on water supply, is facing a historic water shortage. Lading Logistics is dedicated to staying up-to-date with the latest developments in the trucking industry. They offer a wide range of services, including:
- Freight forwarding
- Ocean, train, road, air, and container shipping
- Storage solutions
- Last-mile pickup and delivery
- Retail sales and distribution
- Trade automation services
- Warehousing
By leveraging their expertise and resources, Lading Logistics aims to provide efficient and reliable logistics solutions for their clients.